Under the Hood of Datadog and Grafana: How to Ingest Millions of Metrics Without Crashing
Discover how hyper-scale observability platforms like Datadog and Grafana ingest 10M+ metrics per second without crashing. Learn the secrets of TSDB architecture, lock-free ring buffers, and Gorilla compression.
Author
Viruchith Ganesan
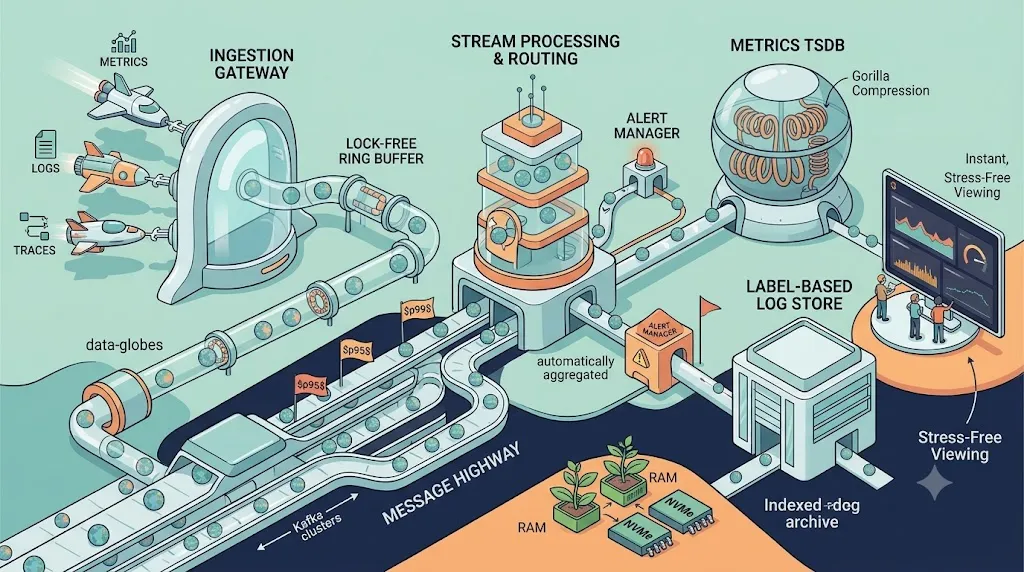
I used to think monitoring infrastructure was straightforward: spin up a time-series database, expose an API endpoint, and let your microservices push their telemetry data. But then I looked at the actual production engineering behind giants like Datadog, AppDynamics, Prometheus, and Grafana, and my mental model changed completely.
These systems process over 10 million events per second simultaneously, compute sophisticated aggregations instantly, and deliver real-time analytical visualizations to engineers—while maintaining stability and preventing Out-Of-Memory (OOM) crashes. Curious about the engineering that powers these bulletproof telemetry systems? Let’s explore the architectural innovations driving planet-scale observability.
At a high level, modern observability platforms behave less like a single database and more like a carefully isolated assembly line:
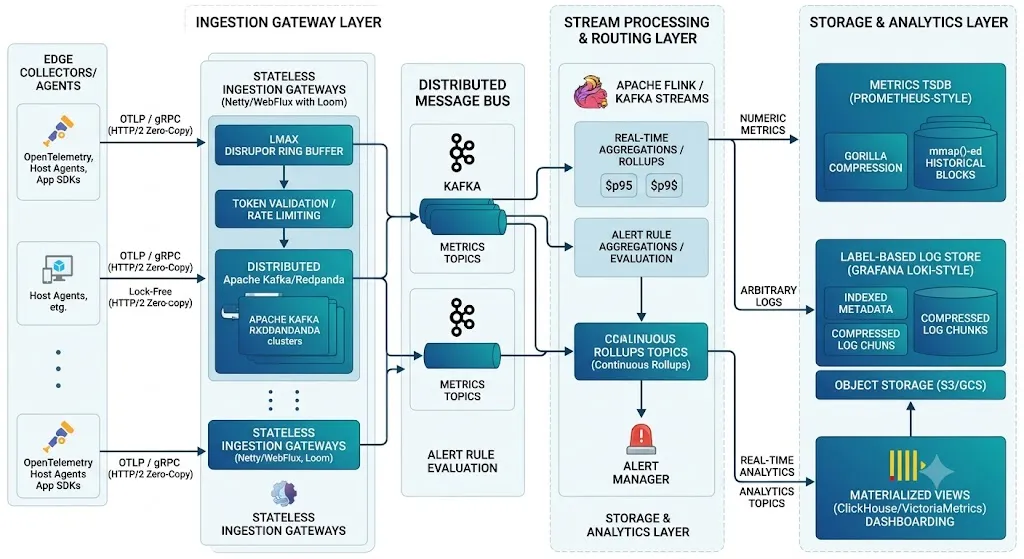
- Edge gateways accept and normalize telemetry.
- A durable transport layer absorbs bursts and decouples producers from storage.
- Stream processors enrich, shard, downsample, and route data into specialized backends.
- Query services read from tiered storage that is optimized for either recent or historical access.
That separation is the core idea repeated throughout the stack. It is what allows the system to stay writable during bursts and still remain queryable during incident response.
1. The Scaling Paradox: Why Traditional Architectures Melt
The core challenge of a telemetry platform is a conflicting workload mismatch. Telemetry systems face a brutal Write-Heavy / Read-Heavy split:
- The Ingestion Path: An unrelenting, uniform firehose of sequential writes. Millions of tiny network packets hitting your edge every single second.
- The Analytical Path: Highly volatile, complex read queries spanning billions of historical data points (e.g., “Give me the
p99response latency of the checkout service over the last 30 days”).
If your ingestion path and query engine compete for the same database resources, thread pools, or memory regions, a single heavy dashboard refresh will choke your ingestion pipeline, causing data loss. To fix this, modern systems strictly separate these domains using a highly optimized event-driven streaming architecture.
This is why production telemetry platforms rarely use a single “universal” storage engine. They split the workload into specialized planes:
- A hot ingest plane optimized for append-heavy writes and short-lived buffering.
- A stream computation plane optimized for fan-out, aggregation, and enrichment.
- A query plane optimized for scans, filters, pre-aggregations, and retention-tier lookups.
Once you see the problem through that lens, most of the engineering decisions start to make sense.
2. Ingestion Wizardry: Embracing Mechanical Sympathy
When you operate at millions of concurrent requests, standard web patterns like “one thread per connection” or naive JSON parsing become major resource hogs. Every memory allocation triggers GC thrashing. Telemetry gateways achieve high efficiency by matching code patterns directly to physical hardware mechanics.
Zero-Copy Stream Routing
Instead of moving bytes back and forth between kernel spaces and user spaces, systems use non-blocking I/O engines (like Netty or custom Epoll bindings). Incoming TCP streams are streamed straight into pooled, off-heap native memory buffers. The payload isn’t parsed into regular heap objects right away; the gateway reads structural headers straight from raw memory, avoiding object allocation altogether.
Lock-Free Ring Buffers (The LMAX Disruptor Pattern)
Standard shared queues rely on heavy thread synchronization and kernel locks, which slow down when hundreds of network threads fight for the same memory address. Hyper-scale systems drop locks in favor of a pre-allocated, contiguous array known as an LMAX Disruptor Ring Buffer. By using atomic Compare-And-Swap (CAS) operations and memory barriers, network threads can instantly dump packets into the ring buffer, allowing downstream consumer pools to batch-process them sequentially without lock contention.
Protocol-Aware Batching
Another major trick is batching work before it becomes expensive. Instead of validating and writing each metric independently, gateways accumulate packets into micro-batches. That lets the system amortize the cost of:
- authentication and tenant lookup,
- decompression,
- schema validation,
- label normalization, and
- network hops to downstream brokers.
When you batch 5,000 points together, you are not just improving throughput. You are reducing syscall pressure, cache misses, and per-record metadata overhead.
Backpressure and Admission Control
No serious telemetry pipeline assumes infinite capacity. If downstream brokers lag or a tenant suddenly explodes cardinality, the edge must shed load gracefully instead of dying dramatically.
Common safeguards include:
- bounded queues between stages,
- per-tenant rate limits,
- payload size caps,
- adaptive sampling for noisy streams,
- and circuit breakers that reject expensive writes before heap pressure becomes fatal.
This is one of the most underappreciated design choices. A stable observability platform is not one that never drops data. It is one that drops data predictably, intentionally, and in the least damaging place.
3. Storage Optimization: The Math Behind 90% Compression
Storing raw time-series metrics down to the millisecond would quickly bankrupt any enterprise. Fortunately, metrics have predictable characteristics: timestamps are highly sequential, and numeric values change very little from second to second. Telemetry databases leverage Gorilla Compression to shrink data footprints by up to 90%.
💡 The Gorilla Method:
Timestamps are compressed using Delta-of-Deltas encoding. If a metric arrives exactly every 15 seconds, the delta-of-deltas is:
which compresses down to a single bit (
'0').Floating-point values are compressed using XOR operations against the previous value. Because consecutive values are visually similar, the XOR leaves a massive string of leading/trailing zeros, allowing the TSDB to store only the meaningful payload bits.
The In-Memory Head Block and mmap()
To keep writes lightning-fast, new metrics populate an active in-memory Head Block while appending to a sequential Write-Ahead Log (WAL) on disk for fault tolerance. Every 2 hours, the head block closes, compresses into an immutable cold block, and is read into the operating system’s address space via the mmap() system call. This lets the OS handle page caching, freeing up application heap memory and preventing OOM failures during heavy queries.
Why Columnar Thinking Helps
Even when a metrics backend is not literally a warehouse-style columnar database, it still benefits from columnar ideas:
- timestamps are stored in compact sequential runs,
- repeated labels are dictionary-encoded,
- query engines can skip irrelevant blocks using metadata, and
- aggregation scans operate over compressed segments rather than raw JSON payloads.
This matters because observability queries are usually aggregate-heavy. Engineers rarely need every raw sample; they need shapes, thresholds, percentiles, and anomaly windows. Compression is therefore not just a storage optimization. It directly improves scan speed and cache locality.
Tiered Retention
The newest data is expensive but operationally critical, so it stays in faster hot storage. Older data moves into cheaper, denser, slower tiers such as object storage-backed blocks. Query coordinators then stitch results across tiers depending on the requested time range.
That design creates a practical cost curve:
- the last few hours stay fast for incident debugging,
- recent days remain interactive for dashboards,
- and older months stay cheap enough for compliance, audits, and trend analysis.
4. The Log Dilemma: Index-Heavy vs. Index-Free
Unlike structured metrics, logs are arbitrary, high-cardinality text payloads. How do platforms like Datadog or Grafana Loki ingest terabytes of logs without running out of disk space or memory? They choose between two contrasting indexing strategies:
- The Inverted Index Model (Elasticsearch/Lucene Style): Tokenizes every word in every log line into a searchable index map. It offers blazing-fast search queries but suffers from high CPU/memory consumption on ingest and massive storage inflation.
- The Index-Free Label Model (Grafana Loki Style): Skips parsing the log text entirely. Instead, it indexes only the high-level metadata labels (e.g.,
service=checkout). The raw text body is packed into compressed chunks and dumped into object storage. This ensures low memory usage during ingestion, relying on distributed, parallelized background query runners to “grep” through chunks when a search is triggered.
There is no free lunch here. You are choosing where to pay:
- index-heavy systems spend more during write time so that reads feel magical later,
- index-light systems spend less during ingest but push more work into the query phase.
That tradeoff becomes especially important in multi-tenant SaaS environments. If every customer can send arbitrary logs with arbitrary fields, full-text indexing can become a runaway cost center. Restricting index scope to a few stable labels is often the only way to keep ingestion economics sane.
The Cardinality Trap
Metrics and logs both suffer from high-cardinality explosions. A label like userId, sessionId, or requestId may look harmless, but if it creates millions of unique series, it can wreck memory usage in index structures, caches, and aggregators.
Mature platforms defend themselves by:
- blocking dangerous label patterns,
- limiting unique series per tenant,
- downgrading unbounded fields into raw log payloads instead of indexed dimensions,
- and surfacing “top cardinality offenders” back to customers.
In practice, cardinality control is as important as compression. A perfectly compressed system can still fail if the metadata model becomes unbounded.
5. Query Execution: Making Dashboards Feel Instant
The hardest query problems in observability are not just about storage. They are about coordination. A single dashboard panel may require merging:
- multiple shards,
- multiple storage tiers,
- multiple pre-aggregation levels,
- and multiple tenants or services.
This is why query systems usually introduce a coordinator layer that fans requests out to workers, pushes down filters, and merges partial aggregates near the end of the pipeline. The coordinator’s job is to avoid pulling raw blocks into memory unless absolutely necessary.
Several optimizations are common:
- Time partition pruning: skip blocks outside the requested range.
- Label-based shard routing: only touch nodes that own the relevant series.
- Pre-computed rollups: answer broad queries from minute or hour tables rather than raw samples.
- Result caching: store recent dashboard answers for the exact same time range and selector set.
Without those optimizations, the query engine becomes the real bottleneck even if ingestion is perfect.
6. Visual Analytics: Rendering Data Without Crashing the UI
Have you ever selected a “Last 30 Days” window on a Grafana dashboard and watched the graph render almost instantly? If the backend sent all 2.5 million raw data points collected during that month, your browser tab would instantly freeze and crash due to memory exhaustion.
Telemetry pipelines avoid this by performing Continuous Rollups using real-time stream processors like Apache Flink. As data pours through the message bus, it passes through tumbling time windows that continuously pre-calculate the min, max, average, and percentiles () for 1-minute, 1-hour, and 1-day resolutions.
When you run wide-range historical queries, the system intelligently queries these pre-aggregated tables. For ad-hoc granular visual downsampling, it implements the Largest Triangle Three Buckets (LTTB) algorithm, reducing millions of raw coordinates into exactly matching pixel-width buckets (e.g., 2,000 points) while perfectly preserving visual spikes and anomalies.
The subtle point is that UI performance starts in the backend data model. If you do not align storage resolution with display resolution, every chart becomes a wasteful serialization exercise. Good observability systems ask a simple question before sending data: what is the minimum number of points needed to preserve human meaning on this screen?
That is why well-designed dashboards often feel far faster than the raw volume suggests. The system is not rendering everything. It is rendering the most informative subset.
7. Failure Recovery: Surviving the Bad Day
Fast systems are impressive. Recoverable systems are valuable.
Telemetry vendors design for partial failure constantly because their customers depend on them most during outages. Typical resilience mechanisms include:
- append-only WALs so in-memory head data can be reconstructed after crashes,
- replicated brokers to absorb node failures,
- shard rebalancing when hot partitions emerge,
- object storage as the durable source of truth for compacted historical blocks,
- and control-plane isolation so customer dashboards do not take down ingestion.
Some platforms even treat delayed ingest as acceptable if it protects durability. In other words, being a few seconds behind is often better than dropping the ground truth during an incident.
8. Practical Design Lessons for Builders
If you are building your own telemetry-heavy service, you do not need Datadog-scale infrastructure to borrow the right ideas.
The most portable lessons are:
- Separate ingest from analytics early.
- Prefer append-only writes and immutable blocks where possible.
- Batch aggressively before validation, storage, and replication.
- Treat cardinality as a product constraint, not just an implementation detail.
- Pre-aggregate for the query shapes your users actually run.
- Design explicit backpressure paths before you need them.
These decisions matter long before you reach millions of events per second. They make smaller systems simpler to reason about and much harder to accidentally destabilize.
9. Epilogue: The Core Takeaway
Learning about the internal architecture of modern observability engines completely changed how I look at system design. Scaling a service to handle millions of concurrent records isn’t about finding a bigger database—it’s about designing smart, decoupled data pipelines, utilizing memory barriers, using highly compressed data representations, and applying smart mathematical downsampling.
The real engineering insight is that observability platforms win by making every stage narrow in purpose. Gateways ingest. Brokers buffer. Stream processors reduce. Storage engines compress. Query coordinators merge. Dashboards downsample. Each layer is intentionally specialized so the system as a whole can absorb chaos without becoming chaotic itself.
That is the deeper lesson behind Datadog-, Prometheus-, and Grafana-style architectures: scale is rarely a single optimization. It is the compounding effect of many small decisions that protect memory, isolate workloads, and keep the slow path from contaminating the fast path.